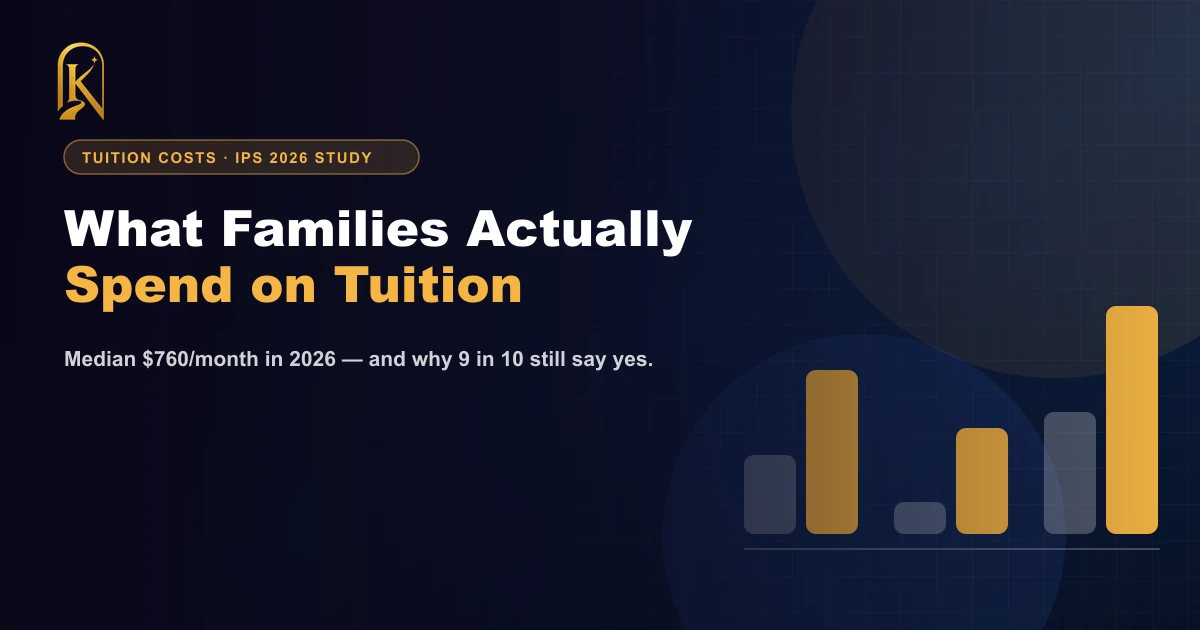

How much does tuition really cost in Singapore in 2026? For the typical family: $500 a month on tuition and $260 on enrichment — about $760 a month, or $9,120 a year, per child. And here is the paradox at the heart of the largest study of Singapore parents in a decade: 89.8% agree children spend too much time on tuition and enrichment — yet 70.2% say they would spend more if they could.
Rather than re-report the news, this guide turns the study's data into the numbers a family can actually budget with — our own tables for the bill, the hours and the decision — and then does something the news stories did not: compares the bill with South Korea, the world capital of private tutoring, using Seoul's own March 2026 figures.
Sources: IPS Working Papers No. 77 (Sep 2026): Parents and Schooling in Singapore, Mathew Mathews, Melvin Tay and Teo Kay Key ; The Straits Times — “S’pore parents spending more on tuition and enrichment; peer pressure cited as a reason: Survey” (25 Sep 2026)
The 2026 Bill: Median vs Mean
Headline comparisons usually quote the median — the middle family — because tuition spending is skewed: a smaller group of families with several children in multiple subjects spends far above the rest, and that pulls the mean (average) up. Both matter: the median tells you what a typical family should budget, the mean shows how much the heaviest spenders move the market. Here is the full picture, including the unadjusted 2016 figures the study reported alongside the inflation-adjusted ones.
The family money stack: what one child costs
Median spending, 2026 · S$ per month · SGSchoolKaki Graphics
| Monthly spending | 2016 (adjusted) | 2026 | Increase |
|---|---|---|---|
| Median — the middle family | |||
| Tuition | $242unadjusted: $200 | $500 | +106% |
| Enrichment | $48unadjusted: $40 | $260 | +436% |
| Combined (our calculation) | $290unadjusted: $240 | $760 | +162% |
| Mean — pulled up by heavy spenders | |||
| Tuition | $386unadjusted: $318 | $677 | +75% |
| Enrichment | $152unadjusted: $125 | $355 | +134% |
| Combined (our calculation) | $538unadjusted: $443 | $1,032 | +92% |
Note: the +106% and +436% increases for the median rows are the published figures. Other percentages are SGSchoolKaki calculations from the rounded amounts. “Combined” is our illustrative family-budget line — a median of sums is not the sum of medians, so treat it as a planning figure. Source: IPS Working Papers No. 77 (Sep 2026), Table 4.2.4b. SGSchoolKaki Graphics.
What does that look like over a childhood? At the 2026 median, one child in tuition and enrichment costs roughly $9,120 a year — about $54,720 across the six primary years in constant 2026 dollars (our simple extrapolation; it assumes spending stays flat, which it has not been doing). Families paying the mean are closer to $12,384 a year.
Median monthly spending: 2016 vs 2026
2016 figures adjusted for inflation · S$ per month · SGSchoolKaki Graphics
Sources: IPS Working Papers No. 77 (Sep 2026): Parents and Schooling in Singapore, Mathew Mathews, Melvin Tay and Teo Kay Key ; The Straits Times — “S’pore parents spending more on tuition and enrichment; peer pressure cited as a reason: Survey” (25 Sep 2026)
The Paradox: Too Much Time, But Spend More
The study's most quoted finding is a contradiction that almost every Singapore parent recognises. We say the hours are too much — and then ask for more classes. Roughly half admit why: other parents are doing it.
| Parents who agree that… | % agree |
|---|---|
| Children in Singapore spend too much time on tuition and enrichment | 89.8% |
| Enrichment helps my child develop skills not taught in school | 88.9% |
| Tuition gives my child an advantage in the PSLE | 84.9% |
| I would spend more on tuition and enrichment if I had the resources | 70.2% |
| I feel pressured because other parents send their children for extra classes | 51.9% |
| I use enrichment classes to prepare my child for the DSA application | 31.8% |
Note: figures are “somewhat agree + agree + strongly agree” from a six-point scale; they do not sum to 100% because each row is a separate question. Source: IPS Working Papers No. 77 (Sep 2026), Figures 4.2.1–4.2.3. SGSchoolKaki Graphics.
The peer-pressure number to watch: 51.9% of parents agreed they felt pressured to send their children for extra classes because other parents do. On the six-point scale, that is 21.5% somewhat agreeing, 16.5% agreeing and 13.9% strongly agreeing — while 48.2% sit on the disagree side. In other words, the “arms race” is real, but it is not universal.
Why Parents Pay: It's Not (Usually) a Rescue Mission
“For nearly 60 per cent (of parents), tuition is not about their children needing some additional help in school… It's just simply because they want to stretch their potential.”
The study's numbers back him up. Parents describe tuition primarily as an advantage in the PSLE (84.9%) and a way to help their child reach their potential (59.5%); about three-quarters say their children need it to keep up with schoolwork and prepare for exams. Enrichment is framed differently — 88.9% see it as building skills not taught in school.
Sources: IPS Working Papers No. 77 (Sep 2026): Parents and Schooling in Singapore, Mathew Mathews, Melvin Tay and Teo Kay Key ; The Straits Times — “S’pore parents spending more on tuition and enrichment; peer pressure cited as a reason: Survey” (25 Sep 2026)
The Hours Behind the Money
Money is only half the ledger. The 2026 wave measured four kinds of preparation outside school, and the shift since 2016 is striking: homework fell by about a third while enrichment hours rose by more than half. Paid help grew; family coaching barely moved.
| Hours per week | Mean (average) | Median (middle) | |||
|---|---|---|---|---|---|
| 2016 | 2026 | Change | 2016 | 2026 | |
| School homework | 6.46 | 4.30 | −33% | 5.00 | 3.00 |
| Tuition | 3.26 | 3.49 | +7% | 3.00 | 3.00 |
| Enrichment | 1.49 | 2.32 | +56% | 1.00 | 2.00 |
| Academic coaching by family | 4.47 | 4.17 | −7% | 3.00 | 3.00 |
Note: change percentages are SGSchoolKaki calculations from the published means. Source: IPS Working Papers No. 77 (Sep 2026), Table 4.2.4a. SGSchoolKaki Graphics.
In plain terms: children spent 4.3 hours a week on homework in 2026, down from 6.46 hours in 2016 — but more time in paid classes outside school. If your household feels like the schoolwork load shrank while the calendar filled up, the data agrees with you.
Sources: IPS Working Papers No. 77 (Sep 2026): Parents and Schooling in Singapore, Mathew Mathews, Melvin Tay and Teo Kay Key ; The Straits Times — “S’pore parents spending more on tuition and enrichment; peer pressure cited as a reason: Survey” (25 Sep 2026)
Where You Live Changes the Equation
The study's housing breakdown is the table the headlines skipped — and it is the most useful part for families. Paid hours rise steeply with housing type, but parent coaching does not fall to compensate. In one- to three-room flats, families do the most coaching at home and use enrichment most often as a DSA route.
| Housing type | Child: paid classes (h/wk) | Parent coaching (h/wk) | Enrichment → DSA |
|---|---|---|---|
| HDB 1–3 roomtuition 2.53 + enrichment 1.59 | 4.12 2016: 3.59 | 4.50 2016: 4.25 | 50.4% |
| HDB 4 roomtuition 3.22 + enrichment 1.92 | 5.14 2016: 4.09 | 4.12 2016: 4.63 | 33.2% |
| HDB 5 room and largertuition 3.22 + enrichment 2.27 | 5.49 2016: 5.10 | 3.87 2016: 4.66 | 28.7% |
| Condo / private apartmenttuition 4.29 + enrichment 3.14 | 7.43 2016: 5.52 | 4.30 2016: 4.07 | 25.7% |
| Landedtuition 5.01 + enrichment 2.76 | 7.77 2016: 6.73 | 4.70 2016: 4.38 | 25.0% |
Note: hours are mean weekly hours across all respondents in each group. “Child: paid classes” is tuition + enrichment for 2026 (our calculation); the small line shows the 2026 split. Bars are scaled to 8 hours a week. The DSA column is the share agreeing they use enrichment to prepare for a DSA application. Source: IPS Working Papers No. 77 (Sep 2026), Figures 4.2.3b and 4.2.5. SGSchoolKaki Graphics.
“(For children in) smaller housing types, this seems to be an area where they are able to get into their school of choice… (or) find a place where he or she can excel in that particular craft or skill set.”
The researchers' own conclusion is the one to remember: greater use of paid tuition and enrichment among private-housing households does not replace academic support provided within the family. The households spending most on fees are also coaching at home 4.3–4.7 hours a week. This is layered investment, not substitution.
Sources: IPS Working Papers No. 77 (Sep 2026): Parents and Schooling in Singapore, Mathew Mathews, Melvin Tay and Teo Kay Key ; The Straits Times — “S’pore parents spending more on tuition and enrichment; peer pressure cited as a reason: Survey” (25 Sep 2026)
The Korea Reality Check: Education Fever, Priced
Singapore parents love to say “at least we're not like Korea”. Korea is the world's extreme case of private education: hagwon (cram schools), late-night study rooms, and the suneung university exam that bends the whole household around it. Seoul publishes the numbers every year — and the latest survey, released in March 2026, is a warning about exactly where Singapore's bill is heading. To make the comparison honest, everything below is quoted in Singapore dollars first, with the original Korean figures in brackets, converted at S$1 = ₩1,038.92 (Yonhap's Seoul brokerage rate, Oct 20, 2026).
One month of private education: Singapore vs South Korea
S$ per month · Korea converted at S$1 = ₩1,038.92 (20 Oct 2026) · SGSchoolKaki Graphics
Note: the two sides are measured differently — the Singapore figure is the median family with a primary-school child (all families, including those spending $0), while the Korean figures are averages per student or per participating student across primary, middle and high school. Use the chart for scale, not for an exact ranking. Sources: IPS Working Papers No. 77 (Sep 2026); Korea 2025 Private Education Spending Survey (Ministry of Education & Statistics Korea); Yonhap FX rates (20 Oct 2026). SGSchoolKaki Graphics.
| South Korea, 2025 survey | 2025 figure | Change vs 2024 |
|---|---|---|
| Total private education spending | S$26.5 billion (₩27.5 trillion; US$20.4b as published) | −5.7% — first fall in 5 years |
| Students in school | 5.02 million | −2.3% |
| Share of students taking private tutoring | 75.7% | −4.3pp (was 80.0%) |
| Monthly spend per participating student | S$581 (₩604,000; US$447 as published) | +2.0% — record high |
| Monthly spend per student, all students | S$441 (₩458,000) | −3.5% |
| Weekly tutoring hours per student | 7.1 hours | −0.4 hours |
| Monthly spend, primary / middle / high school participants | S$493 / S$608 / S$763 (₩512,000 / ₩632,000 / ₩793,000) | All three at records |
| Seoul vs national monthly spend per student | S$638 vs S$441 (₩663,000 vs ₩458,000) | Seoul 45% higher |
| Highest- vs lowest-income households | S$637 vs S$185 (₩662,000 vs ₩192,000) | 3.4× gap |
Note: figures are from the 2025 Elementary, Middle and High School Private Education Spending Survey (Ministry of Education & Statistics Korea, released 12 Mar 2026). S$ conversions are our calculations at S$1 = ₩1,038.92 (Yonhap, 20 Oct 2026); US$ figures are as published. “Participant” = a student who receives private tutoring. Source: Seoul Economic Daily. SGSchoolKaki Graphics.
“Private education spending is not an indicator driven by one factor… Along with declining student numbers, the expansion of public services such as elementary care programs, Neulbom School, and after-school programs appears to have contributed to some extent.”
Three lessons Singapore families can take from Korea
Watch the per-child cost, not the market total
Korea's total spending fell 5.7% in 2025 — but only because 120,000 fewer students were in the system. Spending per participating student still hit a record S$581 (₩604,000) a month. The same trap applies here: Singapore's “$1.8 billion tuition industry” headlines hide the number that matters for your budget — the bill per child.
Public programmes can absorb some of the load
Seoul credits free elementary care, Neulbom School and after-school programmes for part of the decline — 52.2% of primary students now join school after-school programmes, up from 50.9%. Before buying the next package, check what your school already offers: MOE after-school programmes, school-based learning support and community study programmes cost a fraction of private options.
The gap widens as children get older — on both sides
In Korea, the richest households spend 3.4× the poorest (S$637 vs S$185 a month; ₩662,000 vs ₩192,000), and high-schoolers cost S$763 (₩793,000) a month versus S$493 (₩512,000) in primary school. In Singapore, the IPS data shows the same gradient by housing type (2.53 vs 5.01 weekly tuition hours). Whatever your family decides at primary level, plan for the bill to grow — or deliberately cap it now.
Side by side: how the two countries actually compare
Singapore (IPS 2026)
Median family with at least one primary-school child (all families, including those spending $0)
South Korea (2025 survey)
Average student or participating student, across primary, middle and high school
Singapore (IPS 2026)
$760 median family ($500 tuition + $260 enrichment)
South Korea (2025 survey)
S$581 per participating student (₩604,000); S$441 across all students (₩458,000)
Singapore (IPS 2026)
$500 median tuition + $260 enrichment = $760
South Korea (2025 survey)
S$493 per participating primary student (₩512,000); 84.4% participate
Singapore (IPS 2026)
IPS survey covers primary-level families only
South Korea (2025 survey)
S$608 in middle school (₩632,000) rising to S$763 in high school (₩793,000)
Singapore (IPS 2026)
Median bill +162% in real terms since 2016
South Korea (2025 survey)
Per-participant spend +2.0% to a record S$581 (₩604,000) in 2025, even as total spending fell 5.7%
Singapore (IPS 2026)
Tuition 2.53 h/week (1–3-room flats) vs 5.01 h/week (landed homes)
South Korea (2025 survey)
S$185/month lowest income (₩192,000) vs S$637 highest (₩662,000), 3.4×
Sources: Seoul Economic Daily — Korea’s 2025 Private Education Spending Survey (Ministry of Education & Statistics Korea, 12 Mar 2026) ; Seoul Economic Daily — per-student private education spending hits record (8 Apr 2026) ; Yonhap News Agency — Seoul FX brokerage rates, 20 Oct 2026 (S$1 = ₩1,038.92) ; IPS Working Papers No. 77 (Sep 2026): Parents and Schooling in Singapore, Mathew Mathews, Melvin Tay and Teo Kay Key
What Parents Believe About the PSLE and DSA
Parents are not anti-PSLE. 85.9% see it as an important checkpoint that helps students set goals and prepare for secondary school. But 73.7% want some change to the arrangement — and when asked to pick one option, the preference is clear: keep it, but lower the stakes.
| Preferred PSLE arrangement | % of parents |
|---|---|
| Retained, but made less high-stakes | 45.6% |
| Remain in its current form | 19.4% |
| Postponed to a later age | 12.4% |
| Removed altogether | 10.3% |
| No view / not sure | 6.9% |
| Made optional | 5.4% |
Note: single-choice question, so shares sum to 100% (rounding). Bars are scaled to make small differences visible. Source: IPS Working Papers No. 77 (Sep 2026); the same order as the Straits Times graphic. SGSchoolKaki Graphics.
At the same time, two worries sit alongside that preference for lower stakes: 66.3% say the current Achievement Level (AL) scoring makes it harder for their child to get into the school of choice, and 85.6% say the exam still causes significant stress. DSA is the hedge parents reach for — but not the route they prefer.
Sources: IPS Working Papers No. 77 (Sep 2026): Parents and Schooling in Singapore, Mathew Mathews, Melvin Tay and Teo Kay Key ; The Straits Times — “S’pore parents spending more on tuition and enrichment; peer pressure cited as a reason: Survey” (25 Sep 2026)
When Is the Spend Worth It? A Three-Test Checklist
The data cannot tell your family what to do — but it does tell us which reasons parents actually give. Use those as a decision filter before signing up for the next term. (General information, not financial or educational advice.)
The gap test (remedial need)
Is there a specific, named gap — a topic, a skill, a transition — that school support has not closed? If you cannot name it in one sentence, you are probably not buying remediation. Only a minority of parents are: most in the study describe tuition as stretching potential, not fixing weaknesses.
The stretch test (potential)
This is the reason 59.5% of parents give — and it is legitimate. But “stretching potential” has a budget ceiling. At the 2026 median, each additional subject is a four-figure annual commitment. Decide the number of subjects and hours in advance, then stop there — Korea shows how quietly a capped bill becomes an uncapped one.
The mirror test (peer pressure)
Would you still buy this class if no other parent knew? 51.9% of parents admitted feeling pressure because others do it, and 89.8% say children already spend too much time on tuition and enrichment. If the honest answer is “no”, the study suggests you are in the majority — and you can stop.
One more lever the study quietly points to: parent coaching at home is free and substantial — 3.87 to 4.70 hours a week across every housing type. Families who coach consistently may be able to buy fewer paid hours without their child falling behind.
Frequently Asked Questions
What is the “IPS Working Paper” everyone is quoting?
It is a public research report — Working Paper No. 77 — published in September 2026 by the Institute of Policy Studies (IPS), a research think-tank at the Lee Kuan Yew School of Public Policy, National University of Singapore. Three researchers (Mathew Mathews, Melvin Tay and Teo Kay Key) surveyed 1,500 Singaporean and Permanent Resident parents aged 21 to 65 with at least one child in a local primary school between May and August 2026, repeating a similar IPS survey from 2016.
How much do Singapore parents actually spend on tuition and enrichment in 2026?
The median family spends $500 a month on tuition and $260 a month on enrichment — about $760 a month combined, or roughly $9,120 a year per child. The mean (average) figures are higher — $677 for tuition and $355 for enrichment — because a smaller group of heavy spenders pulls the average up. In 2016, after adjusting for inflation, the medians were $242 and $48.
Is tuition mostly about fixing weak subjects?
No. Only a minority of parents describe it that way. In the IPS study, 59.5 per cent said tuition was about helping their child reach their potential, and 84.9 per cent said it gave their child an advantage in the PSLE. IPS principal research fellow Mathew Mathews put it directly: for nearly 60 per cent of parents, “tuition is not about their children needing some additional help in school… It’s just simply because they want to stretch their potential.”
Do children in private housing get more tuition than those in HDB flats?
Yes, on paid hours. In 2026 children in landed homes averaged 5.01 hours a week of tuition and 2.76 hours of enrichment, and those in condominiums or private apartments 4.29 and 3.14 hours — against 2.53 and 1.59 hours for children in one- to three-room HDB flats. But family coaching at home told a different story: parents in one- to three-room flats coached 4.50 hours a week, the highest of any group.
Is Singapore’s tuition culture as intense as South Korea’s hagwon system?
Korea is the global extreme of private education (hagwon = cram school), and its latest official survey (2025, released March 2026) shows how the two countries compare. 75.7 per cent of Korean students take private tutoring, spending S$581 (₩604,000) a month per participating student — a record high — and Korean primary participants alone spend S$493 (₩512,000) a month. Singapore’s median family bill of S$760 a month for one primary child is already at the level Korea charges its high-schoolers (S$763, ₩793,000). The cultural logic is the same in both countries; the timing is different — Korea loads the bill later, Singapore front-loads it earlier. (Korean figures converted at S$1 = ₩1,038.92, Yonhap, 20 Oct 2026.)
What do parents want to change about the PSLE?
About 73.7 per cent prefer some change to the current arrangement, but no single option commands a majority: 45.6 per cent want it retained but made less high-stakes, 19.4 per cent prefer it in its current form, 12.4 per cent want it postponed to a later age, 10.3 per cent want it removed, 5.4 per cent want it optional, and 6.9 per cent have no view. At the same time, 85.9 per cent still see it as an important checkpoint.
Do parents use enrichment classes to prepare for Direct School Admission (DSA)?
Overall 31.8 per cent do — but the figure is much higher among parents in one- to three-room HDB flats, at 50.4 per cent, compared with 33.2 per cent (four-room), 28.7 per cent (five-room and larger), 25.7 per cent (condominiums and private apartments) and 25.0 per cent (landed homes).
Related Resources
PSLE Stress & Tuition Culture in Singapore
The wellbeing side of the same debate: the $1.8B tuition industry, warning signs of overload, and evidence-based coping strategies.
MOE's PSLE, DSA and CCA Review Explained
What the Education Conversations process could change about the PSLE's role in S1 posting, DSA and CCE — and what is confirmed so far.
NYGH DSA 2026 Changes
Why years of enrichment investment can pivot when a school changes its DSA criteria — and how to plan enrichment without over-buying.
Preschool Fees in Singapore to 2030
The earlier years of the same budget story: how preschool costs are projected to move, and what families can plan for.
Budget it, cap it, coach it
$760 a month is the median family's bill, not a target to match.
The typical Singapore family now spends about $760 a month on tuition and enrichment, more than double the inflation-adjusted 2016 figure, while 89.8% of parents say the hours are already too much. Korea shows where the road goes: per-child spending keeps hitting records even when the market “shrinks”, and the bill grows with the child.
Most families are buying potential and insurance against peer pressure, not rescue. Run the three tests above, fix the subjects and hours in advance, and remember that 4+ hours a week of coaching at home is the part of the education budget that costs nothing.
Note on completeness: All figures come from IPS Working Paper No. 77, the Straits Times report of the same study, and Korea's 2025 Private Education Spending Survey (Ministry of Education & Statistics Korea) as reported by Seoul Economic Daily and Yonhap; percentages we calculated ourselves are labelled as such. The IPS study surveyed parents with at least one child in a local primary school, so the Singapore spending figures describe primary-level families, while the Korean figures span primary, middle and high school — the comparison tables flag this difference. Per-subject rates, household-income breakdowns and per-provider comparisons for Singapore are not in the published tables we reviewed, so they are deliberately not included here.
Sources
- 1.Institute of Policy Studies, IPS Working Papers No. 77 (Sep 2026): Parents and Schooling in Singapore — Findings from the 2026 Survey on Singapore’s Education System, by Mathew Mathews, Melvin Tay and Teo Kay Key. lkyspp.nus.edu.sg
- 2.Lee Kuan Yew School of Public Policy, National University of Singapore — IPS Working Papers No. 77 announcement. lkyspp.nus.edu.sg
- 3.The Straits Times, “S’pore parents spending more on tuition and enrichment; peer pressure cited as a reason: Survey”, by Elisha Tushara, 25 Sep 2026 (updated 6 Oct 2026). straitstimes.com
- 4.Ministry of Education (South Korea) & Statistics Korea, 2025 Elementary, Middle and High School Private Education Spending Survey (released 12 Mar 2026), as reported by Seoul Economic Daily, “South Korea’s Private Tutoring Spending Falls 5.7% to 27.5 Trillion Won”. en.sedaily.com
- 5.Seoul Economic Daily, “Korea Private Education Spending Per Student Hits Record High Despite Total Decline”, 8 Apr 2026 (figures 512,000 / 632,000 / 793,000 won by school level; US$447 per participating student). en.sedaily.com
- 6.Yonhap News Agency — Seoul foreign exchange brokerage rates, 20 Oct 2026 (used for all S$ conversions). yna.co.kr
Cite this page: SGSchoolKaki Education Team, “Tuition & Enrichment Costs in Singapore 2026: What Families Actually Spend,” SGSchoolKaki, 23 Oct 2026, https://sgschoolkaki.com/blog/tuition-enrichment-costs-singapore-2026.